USCIS Faces Record Backlog of 742,138 Citizenship Applications
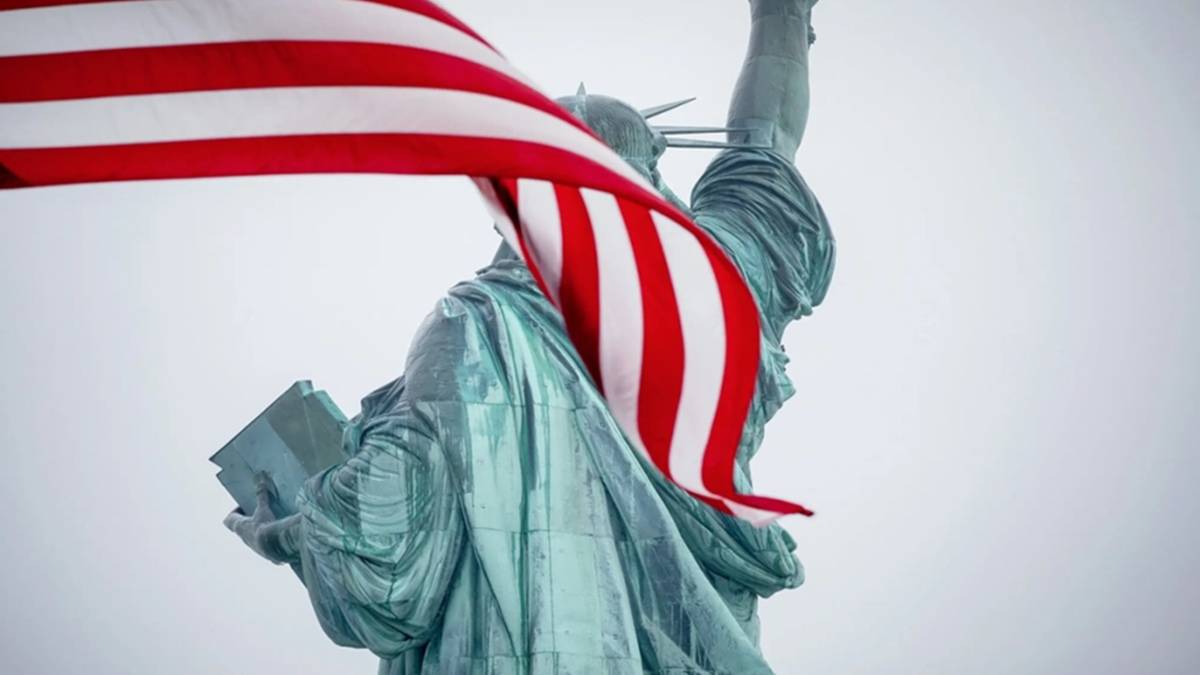
USCIS Reports Significant Citizenship Application Backlog
The U.S. Citizenship and Immigration Services (USCIS) has published its performance metrics for Form N-400, the Application for Naturalization, covering the third quarter of fiscal year 2026, which spans from April to June 2026. The report categorizes data by application type, case status, and field office.
Naturalization Overview
Naturalization allows lawful permanent residents (LPRs) to obtain U.S. citizenship, provided they meet the criteria set forth by Congress in the Immigration and Nationality Act (INA).
Application Statistics
- Total applications received: 145,872
- Applications approved: 57,697
- Applications denied: 12,842
- Pending applications: 742,138 (including military applicants)
Breakdown of Applications
General naturalization accounted for the majority of applications, with:
- 140,179 applications received
- 54,974 approved
- 12,591 denied
- 727,371 pending
For military naturalization, which pertains to applicants eligible due to their service in the U.S. armed forces:
- 5,693 applications received
- 2,723 approved
- 251 denied
- 14,767 pending
Processing Speed Concerns
Despite the influx of applications, USCIS is not keeping pace with the volume. The agency processed 70,539 cases (approvals and denials combined), which translates to approximately 48 decisions for every 100 applications received. Denials constituted about 18.2% of the total decisions made.
Pending Applications by Office
As of the end of Q3, the following field offices reported the highest number of pending applications:
- Houston: 31,057
- Dallas: 28,662
- Chicago: 23,623
- San Jose: 20,899
- San Antonio: 18,999
Dallas led in new applications received at 6,167, followed closely by Houston (5,545) and Chicago (5,077). Houston also had the highest approval rate, with 4,441 approvals, trailed by Dallas (3,089) and Brooklyn (2,526).
Denial Rates and Variances
Brooklyn reported the most denials, totaling 733. Other significant denial rates were observed in Queens (706), New York (706), Newark (578), and Houston (437). The disparity in denial rates among different offices is notable; for example:
- Queens denied 706 of 1,533 cases (46.1%)
- Newark denied 34.6%
- Greer, SC, denied only 5.6% of cases
Military Naturalization Insights
Greer received the highest number of military naturalization applications at 1,252, followed by San Antonio (982) and Chicago (652). Notably, military naturalization applications benefit from significantly shorter median processing times of 2.6 months, compared to 9.5 months for general applications.
Conclusion
While completions are robust, the substantial backlog of over 727,000 applications highlights a persistent gap between incoming requests and processing capabilities for naturalization.
Additional Information
Supporting forms such as N-565, N-600, N-336, and N-648 continue to contribute to ongoing activity in the citizenship process, from initial applications to certificate issuance, replacements, and appeals.
Disclaimer: This article is for informational purposes only and does not constitute legal, immigration, or tax advice. For the most accurate updates, please consult the official government portals.
Source Reference (financialexpress.com): US citizenship backlog hits 742,138 as USCIS decides just 48 cases per 100 received